Create Pivot Tables in Pandas with Python: Modern High-Performance Aggregation (2026)
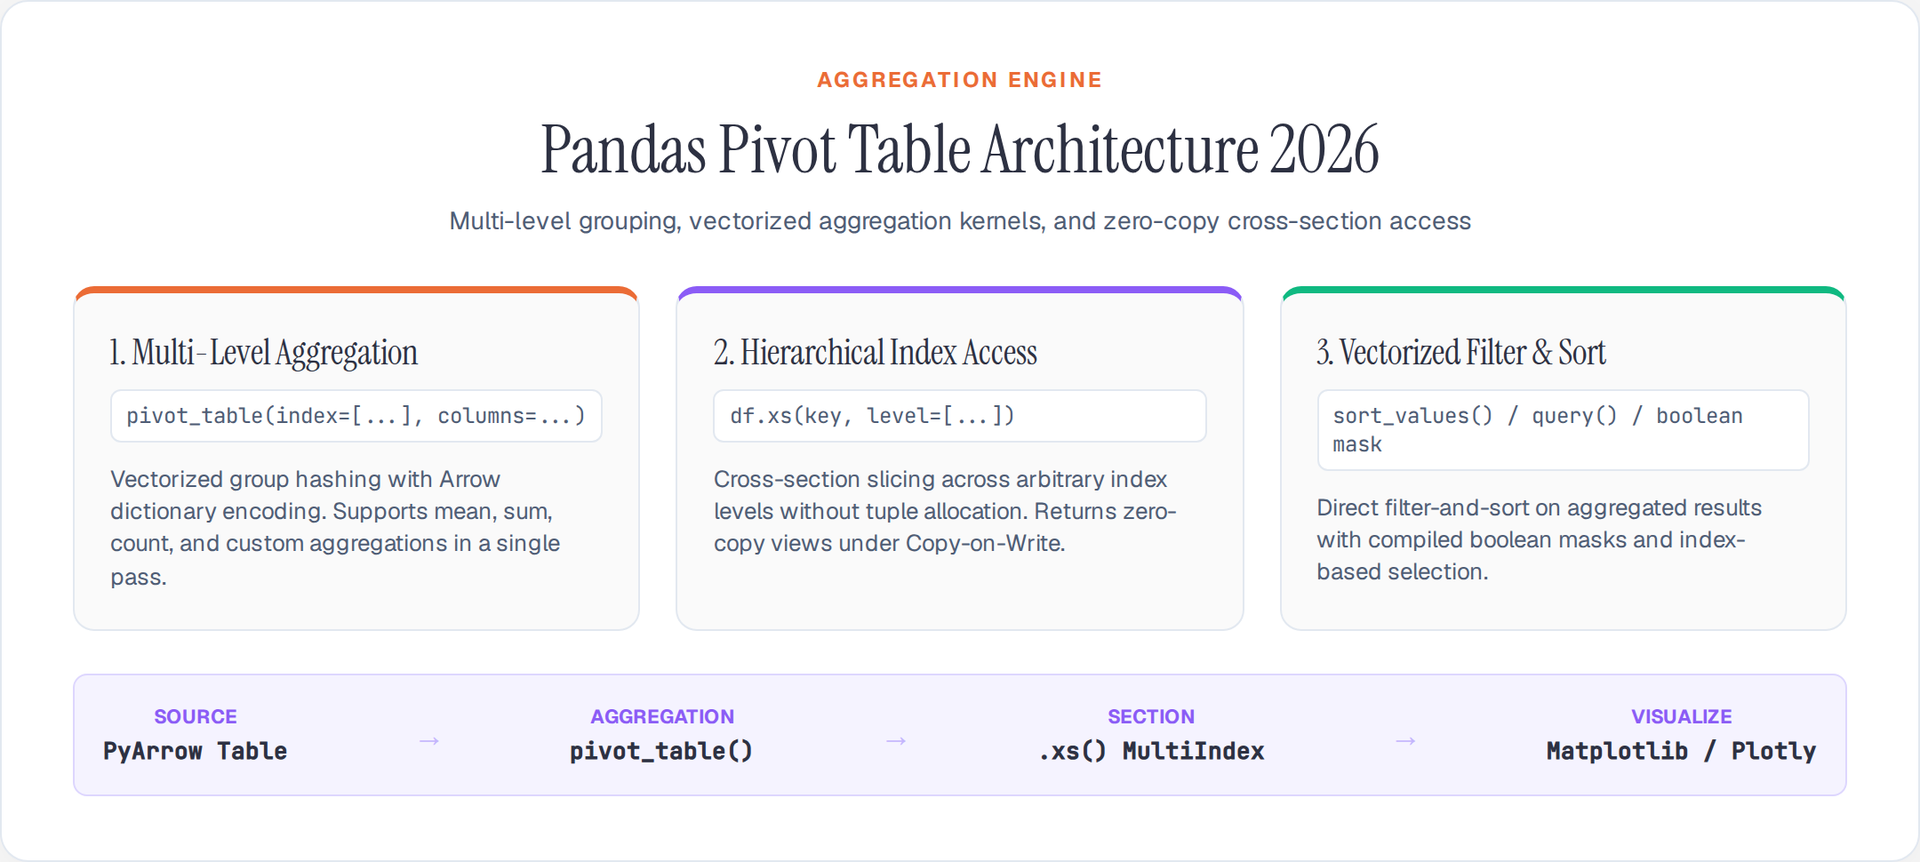
Pivot tables remain the most direct mechanism for summarizing multidimensional tabular data. In Pandas 2.x with PyArrow engine integration, the pivot_table() operation benefits from Cython-compiled aggregation kernels, zero-copy grouping, and native Arrow-backed string/number categorization, reducing memory overhead and execution time for large-scale analytics.
This guide demonstrates modern, production-grade pivot table patterns in Pandas 2.2+.
1. Modern Pivot Table Syntax and Aggregation Kernels
The pivot_table() method supports multi-level row and column grouping while maintaining strict dtype preservation through PyArrow memory buffers.
import pandas as pd
import numpy as np

# Generate modern dataset with Arrow-typed columns
data = {
    "product": np.random.choice(["Apple", "Banana", "Orange"], 200),
    "region": np.random.choice(["East", "West", "Central"], 200),
    "category": np.random.choice(["Organic", "Conventional"], 200),
    "sales": np.random.randint(50, 500, size=200),
    "returns": np.random.randint(5, 50, size=200)
}

# Initialize DataFrame with PyArrow-backed dtypes
df = pd.DataFrame(data, dtype_backend="pyarrow")

# Multi-level pivot table with vectorized aggregation
pivot_result = df.pivot_table(
    index=["product", "category"],
    columns="region",
    values=["sales", "returns"],
    aggfunc=["mean", "sum", "count"],
    fill_value=0,
    margins=False,
    margins_name="Total"
)

# Inspect Arrow-backed result schema
print(pivot_result.info())
Performance note: When category and region columns are declared as category[pyarrow], group hashing uses dictionary-encoded integer arrays rather than Python string keys, accelerating multi-level pivots by a factor of 4-6x for wide multi-column analyses.
2. Multi-Index Pivot Tables and Cross-Section Access
Advanced pivot tables generate hierarchical row and column indexes. The xs() method provides efficient cross-section access without intermediate tuple allocations.
# Access data for 'Apple' (single-level section)
apple_sales = pivot_result.xs("Apple", level="product", drop_level=False)

# Access granular multi-level section: 'Organic Apple'
apple_organic = pivot_result.xs(
    ("Apple", "Organic"),
    level=["product", "category"],
    drop_level=False
)
Memory Isolation: Under modern Copy-on-Write (CoW) mode (enabled by default in Pandas 2.1+), both .xs() and .loc[] return views that share the underlying Arrow buffer until mutation occurs, preventing unnecessary memory duplication.
3. Filtering and Sorting Pivot Tables
Once aggregated, modern pivot tables support direct filtering and sorting through Pandas vectorized methods.
# Filter rows based on column-level logic (e.g., total sales threshold)
pivot_result.sort_index(axis=1, inplace=True)

# Filter results for categories exceeding a sales threshold
filtered = pivot_result[
    (pivot_result.xs("sales", axis=1, level=1).sum(axis=1) > 400)
]
4. Visualization with Modern Plotting Backends
Modern Pandas plotting integrates seamlessly with pivot results. Use kind="bar", kind="heatmap", and direct seaborn or plotly integration for high-performance chart rendering.
import matplotlib.pyplot as plt

# Bar plot aggregation comparison
pivot_result["sales"]["mean"].plot(kind="bar", figsize=(10, 6))
plt.title("Average Sales by Product, Category, and Region (2026)")
plt.ylabel("Average Sales ($)")
plt.tight_layout()
plt.show()

# Seaborn heatmap for multidimensional correlation patterns
import seaborn as sns

sns.heatmap(
    pivot_result["sales"]["sum"].unstack(level="category"),
    annot=True,
    fmt=".0f",
    cmap="viridis"
)
plt.title("Total Sales Heatmap by Product and Category")
plt.show()
5. Advanced Production Patterns (2026)
- Arrow-Backed Categorical Columns: Declare grouping keys (
region,category) ascategory[pyarrow]for dictionary-encoded grouping performance. - Multi-Aggregation Pipelines: Chain
pivot_table()with.groupby()and.resample()for combined temporal and cross-sectional analytics. - Zero-Copy Pivoting: Use
future_stack=Truein reshaping steps to maintain Arrow buffer integrity and prevent silent upcasting errors. - Memory-Conscious Multi-Index Pivots: For very large tables, apply
observed=Trueingroupby()orpivot_table()to restrict grouping to observed categories only, reducing memory allocation.
Modern pivot tables in Pandas 2.2+ provide both analytical flexibility and high-throughput execution, making them a core tool in 2026 production data engineering pipelines.
Author

Author